
By Torus Lu
In one way or another, many of the statistics used to track American economic activity can be misrepresented to support the president’s policy goals. The current White House has embraced that fact wholeheartedly. Here’s a list:
Trade Deficits
The Wall Street Journal has reported that the Trump administration is considering altering the way trade deficits are calculated. Specifically, the proposed change will remove re-exports from the trade balance calculation. Re-exports are exported goods that were originally manufactured in a foreign country. At some point prior, the good entered America as an import, but instead of being consumed in the domestic market, headed to another foreign country as an export.
Under the current system of calculating exports, the value of the re-exported good is added to exports. Since a re-exported good is not actually made by American workers, the current system inflates exports by including re-exports. This is particularly true in the case of our NAFTA trade partners. As there are no tariffs between Canada, Mexico, and America, America has become a center for re-exports from other countries destined for Canada or Mexico. Removing re-exports from the export calculation would nearly double the trade deficit with Mexico, for example.
The political motivation is clear. Trump, a harsh critic of trade deals such as NAFTA, would no doubt prefer to use the larger trade deficit numbers in discussions regarding the effects of trade deals. Trade deficits involve an outflow of dollars. It is easy to frame that as America getting cheated by bad trade deals, as the president has done both before and after his election. The greater the trade deficit, the worse Trump can say America has been cheated. Along this line of logic, he has some unlikely allies. In 2014, Rep. Keith Ellison (R-MN), now the Deputy Chair of the Democratic National Committee, signed on to a letter advocating for the same change in trade deficit calculation. He was joined by 13 other House Democrats.
However, this change would be problematic for multiple reasons. First, the correction for the exports side of American trade does not have an equivalent on the imports side. Therefore, the change would leave a significant portion of re-exports tallied on the imports side but not on the exports side, artificially inflating the trade deficit. Second, re-exports still play an important role in the American economy. Although re-exported goods are not made in America, the emergence of America as a re-export hub is a major contribution to the American economy. Plenty of those employed by the various transportation industries (truck drivers, shippers, etc.) are employed because of re-exports. Third, such a narrow focus on trade deficits overlooks the immense globalization of the American economy. Supply chains for manufactured goods now spread across international borders, and the distinction of American-made goods is much less meaningful. Some products cross the U.S.-Mexican border 14 times before heading to a consumer market, and the average import from Mexico sees 14 percent of its value made in America. And lastly, economists tend to consider most policies designed to reduce trade deficits as bad for the vast majority of Americans.
There’s a reasonable alternative. Intimately familiar with the re-export issues, the World Trade Organization and Organization for Economic Co-operation and Development have calculated value-added trade balances: essentially, exports would only be tallied when a country actually adds value to the good. So a re-exported good would not contribute to exports but also would not contribute to imports, and a manufactured good that has parts made in both Mexico and America would only contribute the portion produced by American manufacturing to exports. The less-attractive part of this is that it would not paint such a gloomy picture of U.S. trade deficits. Compared to the current method of calculating exports and imports, the value-added approach would decrease the trade deficit with Mexico by 43 percent, and the trade deficit with Canada by 39 percent. If the Trump administration was interested with the accuracy of exports numbers, it would be considering a value-added approach instead. The actual push to change how deficits are calculated is instead very clearly intended to provide ammunition to those looking to attack trade deals.
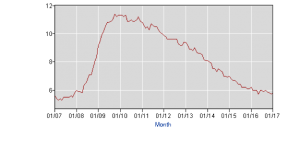
Unemployment
In early January, the president proposed changing the official unemployment rate. The current rate is U-3 and is calculated by the Bureau of Labor Statistics (BLS). During the 2016 presidential campaign, Trump called the BLS monthly report “phony” and preferred presenting an unemployment rate of 42 percent. Or 21 percent, if he felt like changing things up. The proposed change would instead use the U-5 rate, also calculated by the Bureau of Labor Statistics. As of January 2017, the official unemployment rate stands at 4.8 percent, and the U-5 rate stands at 5.8 percent.
This change could actually be good. The reason why the U-5 rate is higher is that it also includes discouraged workers and those marginally attached to the labor force. Heidi Shierholz, former chief economist for the Labor Department under the Obama administration, argues that this might be a more accurate picture of the current unemployment situation. Moreover, altering the official unemployment rate would not make a significant change to the way economic policy-making works, given that it is already part of the six measures of unemployment that the Bureau of Labor Statistics publishes monthly, and policymakers already pay attention to all of them.
On the other hand, switching to U-5 would involve some difficulties in backward-looking comparisons. U-5 has only been around since 1994, while U-3 has been recorded back to 1948. In any case, U-5 is currently at pre-Recession levels.
National Debt
Trump recently tweeted a complaint that the media was not covering the $12 billion reduction in national debt during the first month of his administration, compared to the $200 billion increase in national debt during the first month of the Obama administration. This is factually true, but also highly misleading.
No legislation relating to the fiscal operation of the United States government has been passed. It seems a bit odd, then, that debt reduction occurred when no spending cuts (or tax revenue increases) were actually made.
According to daily Treasury statements from January 20, 2017 to February 21, 2017 (no statements released on President’s Day), the total public debt fell from $19.947 trillion to $19.935 trillion. However, some more digging reveals that this fall can be entirely attributed to a decrease in intragovernmental debt, i.e. debt the government owes to itself. There was actually an increase in debt held by the public, such as debt held by private individuals, investors, and foreigners, of approximately $90 million during the first month.
Additionally, the statements show that the Trump administration inherited $382 billion from the Obama administration, and a month later, that figure was now $267 billion, a decrease of $115 billion.
GDP
The Washington Post’s Catherine Rampell has reported that the Trump transition team ordered Council of Economic Advisers (CEA) staffers to predict sustained economic growth of 3 to 3.5 percent and then devise calculations that would support that predictions in their models.
The usual method for CEA economic projections happens in reverse. CEA staffers make baseline projections of economic growth and then adjust those projections for the expected impact of the president’s policy proposals. The final result would be the projected economic growth. Since the president will be hoping to implement pro-growth policies, the projections are usually somewhat more optimistic than those coming from outside sources, such as the Federal Reserve, Congressional Budget Office (CBO), and private forecasters.
But this isn’t the normal process, and the growth projection isn’t just somewhat more optimistic. Consider the Obama administration’s economic projections presented in February 2016. The CEA projected 2.7 percent real growth, while the CBO projected 2.7 percent real growth; the Blue Chip (outside business economists firm) forecast was 2.6 percent. Given that the 2017 real growth forecasts from the Federal Reserve and CBO stand at 1.9 percent and 1.8 percent, respectively, the demanded growth projection would diverge from outside forecasts by more than a percentage point, about 10 times as much as the CEA’s divergence from other forecasts in 2016.
Rampell argues that the purpose of these unjustifiably optimistic projections is to make budgeting easier for the administration. Higher growth means higher tax revenue, and that makes it easier to justify, say, tax cuts, without acknowledging the impact on budget deficits. If those higher projections end up not occurring because they have no foundation in reality, it will presumably be worse in the long-term. But it makes things sound good right now.